The Plastic Expedition

The Plastic Expedition with Nordic Ocean Watch Denmark

Monday, August 12, 2019, the expedition ship S/V Linden sets sails from Longyear in Svalbard. Nordic Ocean Watch Denmark is on board with a main focus on marine pollution. In collaboration with the organisation Ekspedition Plastik, we will collect data for scientific research to increase awareness on plastic pollution. 

Plastic pollution has become one of the greatest environmental challenges of our time. It is estimated that 8-10 million tons of plastic waste ends up in the oceans every year (1). Plastic pollution has a devastating effect on the marine environment and marine animals. 

Ocean currents in the Atlantic Ocean serves as long-range transport for plastic waste, carrying waste from foreign parts of the world to the Arctic, making the Arctic a sink for plastic waste. It is estimated that there are 300 billion pieces of plastic in the Arctic Ocean. The unique Arctic ecosystem is especially sensitive to plastic pollution (2).

The organisation Plastic Change began The Plastic Expedition in 2014 and from 2014-2018 they have collected data during expeditions in the Mediterranean, the Atlantic, the Pacific, and in Danish waters. The expedition is now carried on by the organization Ekspedition Plastik with a main focus on the Arctic areas. All data is shared with the American institute 5Gyres (3). 5Gyres collects data from research projects all over the world in order to map out how plastic pollution develops in terms of both volume and area.  

On our expedition to Svalbard we will collect data from the arctic waters of Svalbard to determine the amount of microplastic on the ocean surface and thereby the extent of plastic pollution and create awareness on the impact plastic pollution has on the marine environment and wildlife. The Arctic areas are some of the most desolated and distant areas with very little human activity, and at the same time an area with a thriving wildlife. 

Nordic Ocean Watch Denmark’s main focus is to increase awareness of ocean pollution through education and activation. We share our love for the ocean by arranging lectures, works shops, beach cleanups and other activities to protect our oceans and by conducting research on sailing expeditions like The Plastic Expedition on Svalbard. We work together as a team in collaborations with other organizations because together we increase our outreach and positive impact. Take action now and help us to take care of the ocean. 

Check the website for updates on The Plastic Expedition on Svalbard. 

Regitze Andersen

(1)https://www.ellenmacarthurfoundation.org/assets/downloads/EllenMacArthurFoundation_TheNewPlasticsEconomy_Pages.pdf

(2)https://www.nordicoceanwatch.dk/ocean-currents-gyres

(3)https://www.5gyres.org


Svalbard & data collection

Arrived at Svalbard and realised just how beautiful the surroundings are north of the Arctic Circle. S/V Linden was waiting for me at the dock in Longyearbyen surrounded by snow-capped mountains.Linden is a three-masted wooden schooner powered with 365 square meters of sail and well equipped for adventures in the high Arctic. This schooner is built in Åland in 1993 as a replica of the original Linden of 1920. It is the biggest wooden schooner in Europe still sailing. Linden is made for sailing the cold Baltic Sea, and its ice-strengthened hull enables it to take on the sea ice in Svalbard’s waters.There is almost 50 meters of Linden lengthways and 9 meters across. The spacious outdoor viewing decks are a key feature. You have full 360 degrees view of the Arctic landscape with the opportunity to photograph wildlife nearly at eye level. From the rooftop or the top of the mast, you can spot wildlife even further away. Read much more about S/V Linden here www.sv-linden.com.

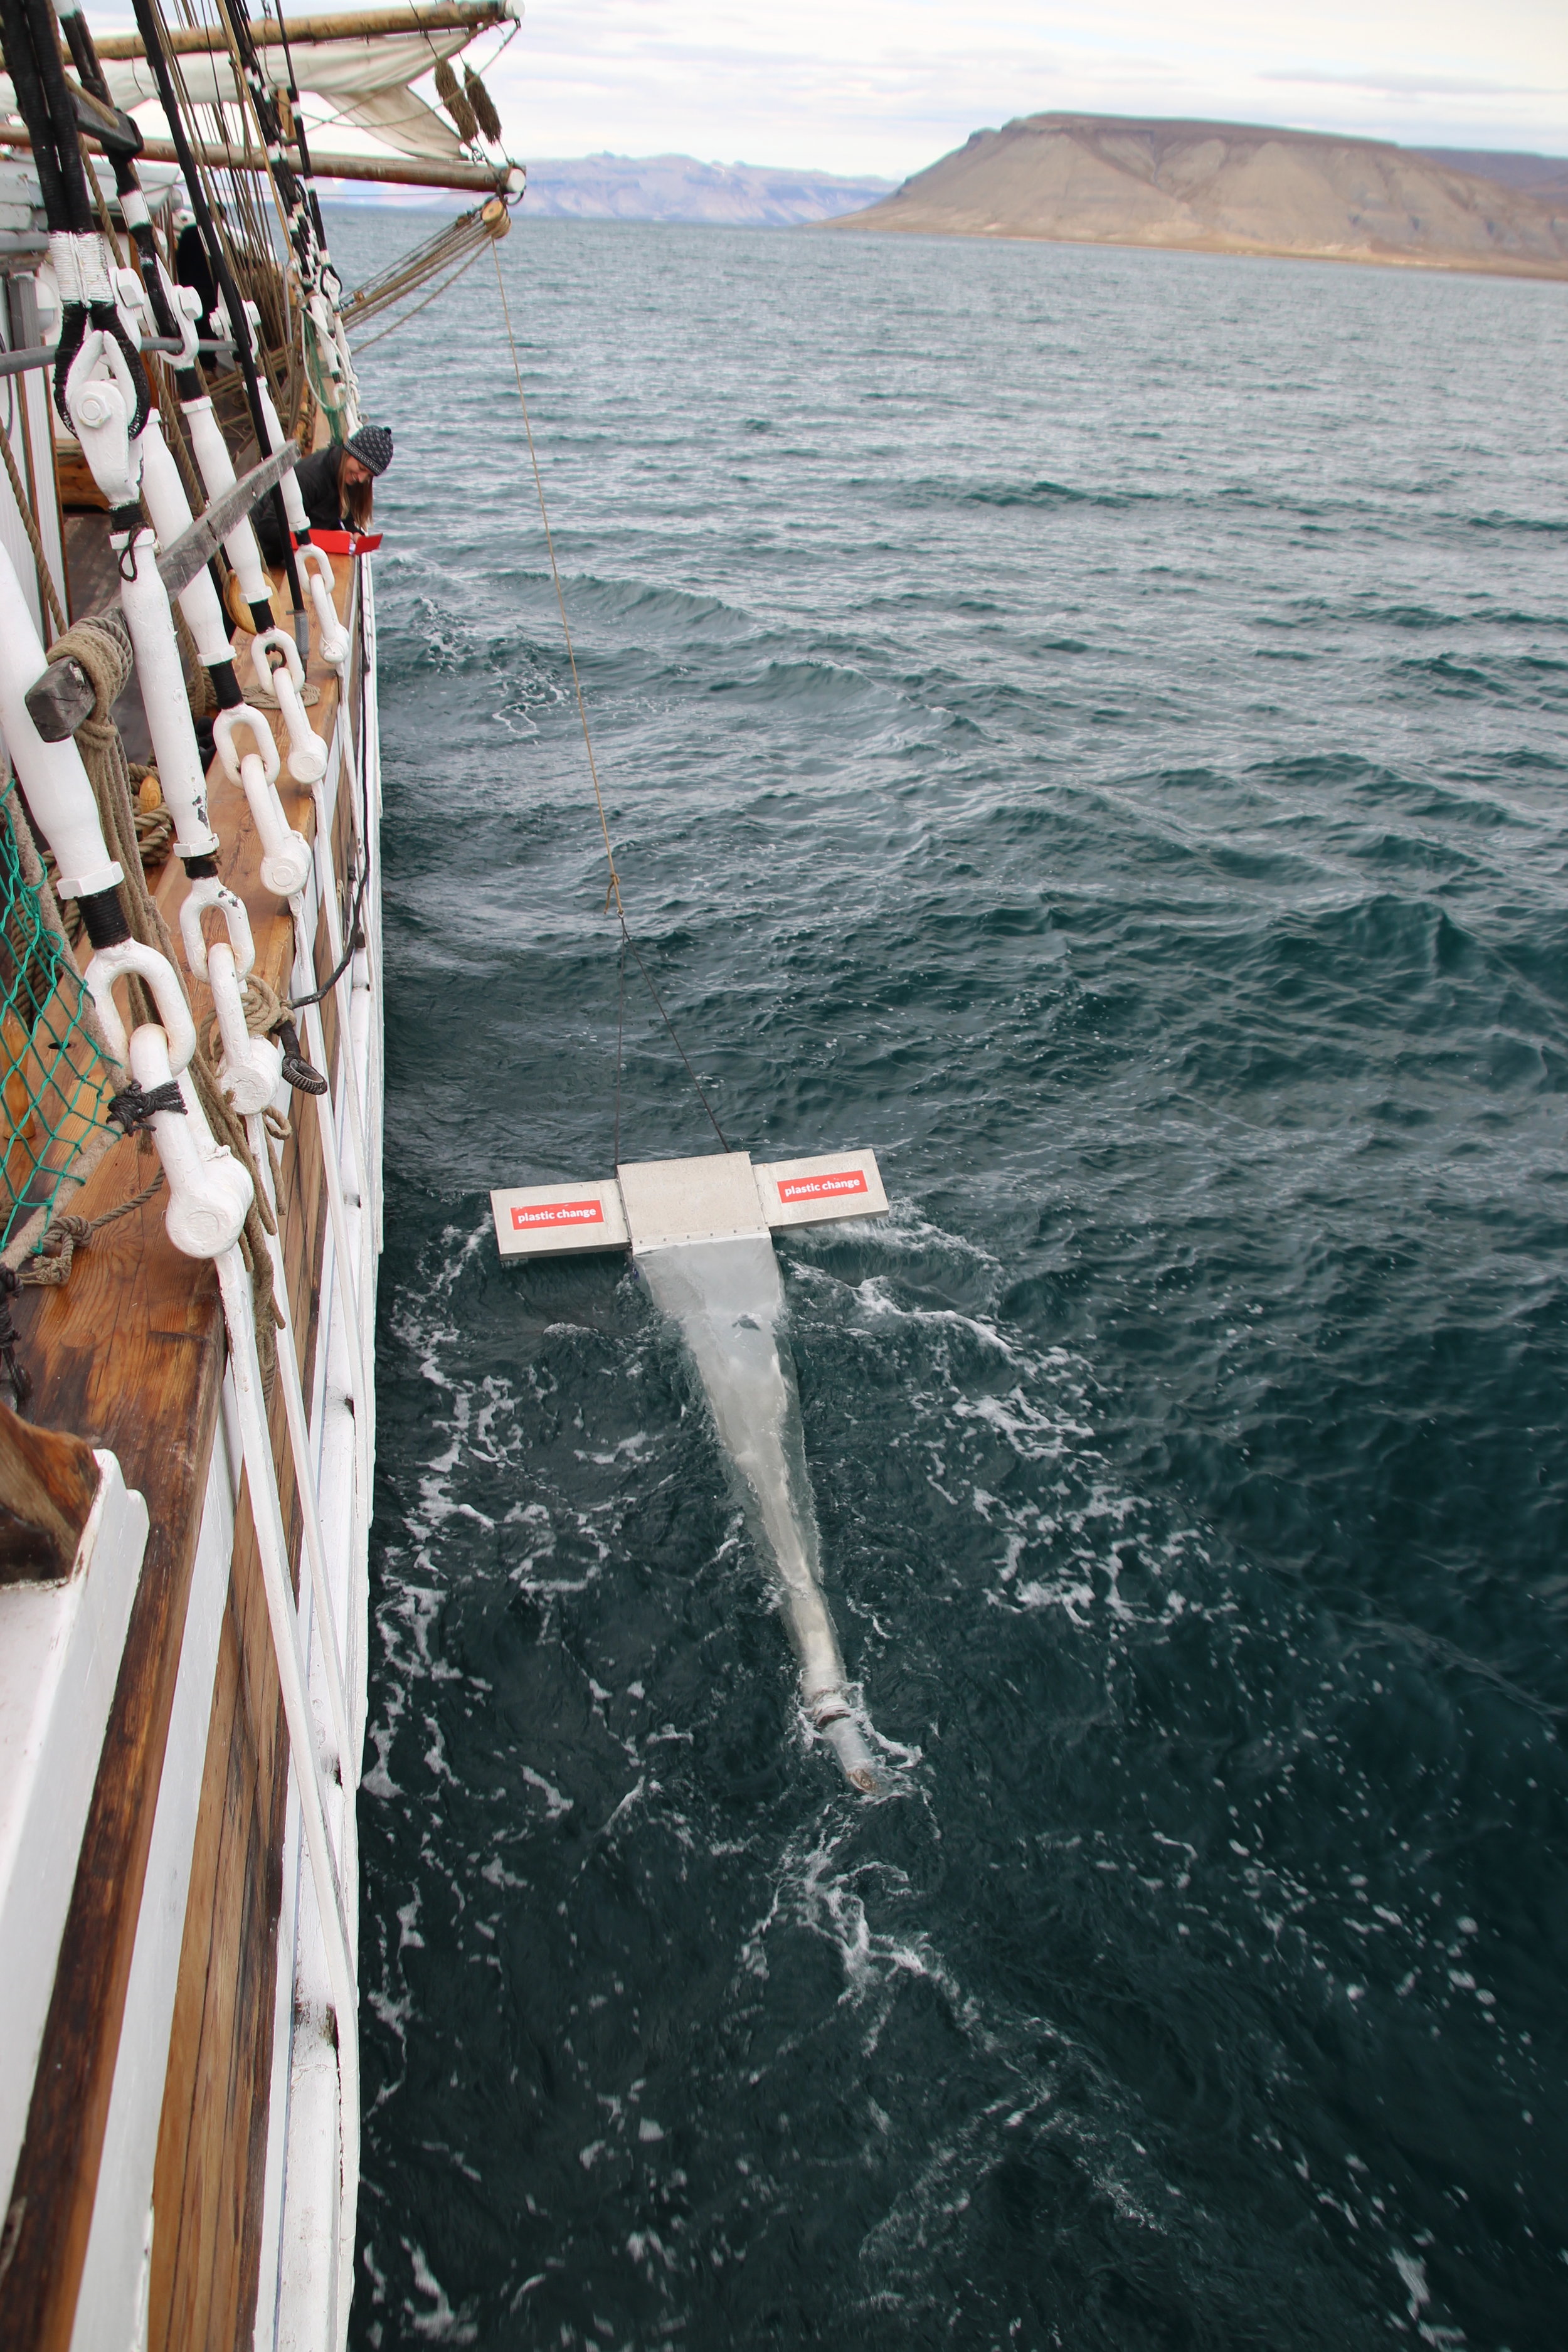
On board S/V Linden we will set the Manta trawl and collect data from the arctic waters of Svalbard to determine the amount of microplastic on the ocean surface and thereby the extent of plastic pollution and create awareness on the impact plastic pollution has on the marine environment and wildlife. The Arctic areas are some of the most desolated and distant areas with very little human activity, and at the same time an area with a thriving wildlife. 

The Manta trawl is a 60 cm fine weaved trawl which is set for 30 min on the sea surface. The trawl will collect everything on the sea surface and afterwards everything in the trawl will be analysed for microplastic. All data is shared with the American institute 5Gyres (1). 5Gyres collects data from research projects all over the world in order to map out how plastic pollution develops in terms of volume and area. The fist trawl has been sat and the first sample collected. The Plastic Expedition has begun.      

#5GyresTrawlShare

Regitze Andersen

(1)https://www.5gyres.org

MANTA TRAWL TRAWLSHARE PROTOCOLS

5gyres.png

MANTA TRAWL TRAWLSHARE PROTOCOLS

A note on communication: The TrawlShare program depends on our citizen scientists sharing their experiences. In addition to providing data, please share photos on social media and hastag #5GyresTrawlShare. Our team will report and highlight your efforts to the 5 Gyres community.

HOW TO COLLECT AN OCEAN SAMPLE

MATERIALS PROVIDED BY 5 GYRES:

5 Gyres Trawl (Manta Trawl) Data Sheets and Graph Paper

OTHER MATERIALS YOU WILL NEED:

1mm Sieve
Metal Tweezers, Metal Spoon, and Toothbrush (with natural bristles) Wash Bottle
Handheld Magnifying Glass
Ruler
Digital Camera
Envelopes or Sample Jars
Flow Meter (Optional)

TRAWL ASSEMBLY – Once you receive the trawl, you will need to put it together. For the Manta Trawl, you will need to attached the two wings with the provided bolts. Please use a piece of sand paper to smooth the end of the PVC pipe that attaches to the cod end (best to do over a garbage can). You will also need to attach the cod end to one side of the PVC pipe with one of the hose clamps. Then attach the other side to the end of the netting with the other hose clamp. Make sure all fasteners are VERY tight. They tend to slip off easily when deployed. Plan to tighten them before each deployment. Attach the bridle and you’re ready to go!

DATA RECORDING - Record all information for “Start/Stop Data” and “Sea and Boat Conditions” at deploment and recovery of each trawl. Number each sample separately. Sea State, Boat Speed, Boat Direction, Wind Direction, and Wind Speed will be recorded at deploymet and recovery. If possible, use the onboard knot meter to determine boat speed. If you are using a flow meter, attach the flow meter so that it falls in the center of the mouth of the trawl (not below the trawl).

POSSIBLE PERMITTING REQUIREMENTS - If you are within 200 miles of a shoreline, you may need environmental permits from state and federal agencies to

carryout data collection. The requirements vary state to state and country to country, but generally speaking, it is good to contact your state agency to confirm that you do not need any specific permits. Special areas, like marine protected areas and sanctuaries, often require additional clearance. These are things to take into consideration when planning your project.

protocol.jpg

DEPLOYMENT - Deploy the trawl outside of the wake zone to the best of your ability. Turbulence inside the wake zone does can push plastic deep underwater. You may wish to use a spinnaker pole or a davit to position the trawl tow line away from the side of the boat. Watch the net while you trawl to observe its performance and adjust the length of the tow line and vessel speed if it’s bouncing along the surface.

Skærmbillede 2019-07-24 kl. 11.59.22.png
Sk%C3%A6rmbillede+2019-07-24+kl.+11.59.35.jpg

TRAWL SPEED/DIRECTION – Maintain a steady linear course (you do not want the tow line to come under the vessel). The vessel should go <3 knots while towing the Manta Trawl. If the trawl is leaping out of the water or plowing under a wave, then you’re going too fast. Watch the trawl and adjust accordingly. Remember not to trawl in Sea State 4 or above. You need to watch the sea state and may need to recover the trawl if winds are above 16 knots. The trawl should not bounce or dip below the surface. It should travel smoothly across the water surface.

TRAWL DURATION – The Manta Trawl should be deployed for 30 minutes (up to 60 minutes), ideally in a straight transect. You want to avoid letting the cod end on the

back of the trawl fill with zooplankton, which can happen when trawling at dusk when zoolankton migrate to the surface.

RECOVER TRAWL - Recover and secure trawl on boat (watch any loose lines). Record STOP DATA immediately. It is very important to record the most accurate latutitude and longitude.

Skærmbillede 2019-07-24 kl. 12.01.40.png

HOW TO ANALYZE AN OCEAN SAMPLE

MATERIALS YOU WILL NEED:

1mm Sieve
Metal Tweezers, Metal Spoon, and Toothbrush (with natural bristles) Wash Bottle
Handheld Magnifying Glass
Ruler
Digital Scale
Digital Camera
Envelopes or Sample Jars

SAMPLE PREPARATION

1. Pour sample from codend in to the 1 mm sieve and use spoon/toothbrush to brush it all in.

2. Rinse the codend and toothbrush gently with the wash bottle so that all plastic particles are included.

Skærmbillede 2019-07-24 kl. 12.02.44.png

SAMPLE SORTING

  1. Use tweezers to remove all recognisable pieces of plastic from the 1 mm sieve, and transfer all plastic materials directly into a glass bowl or jar, or onto graph paper (provided).

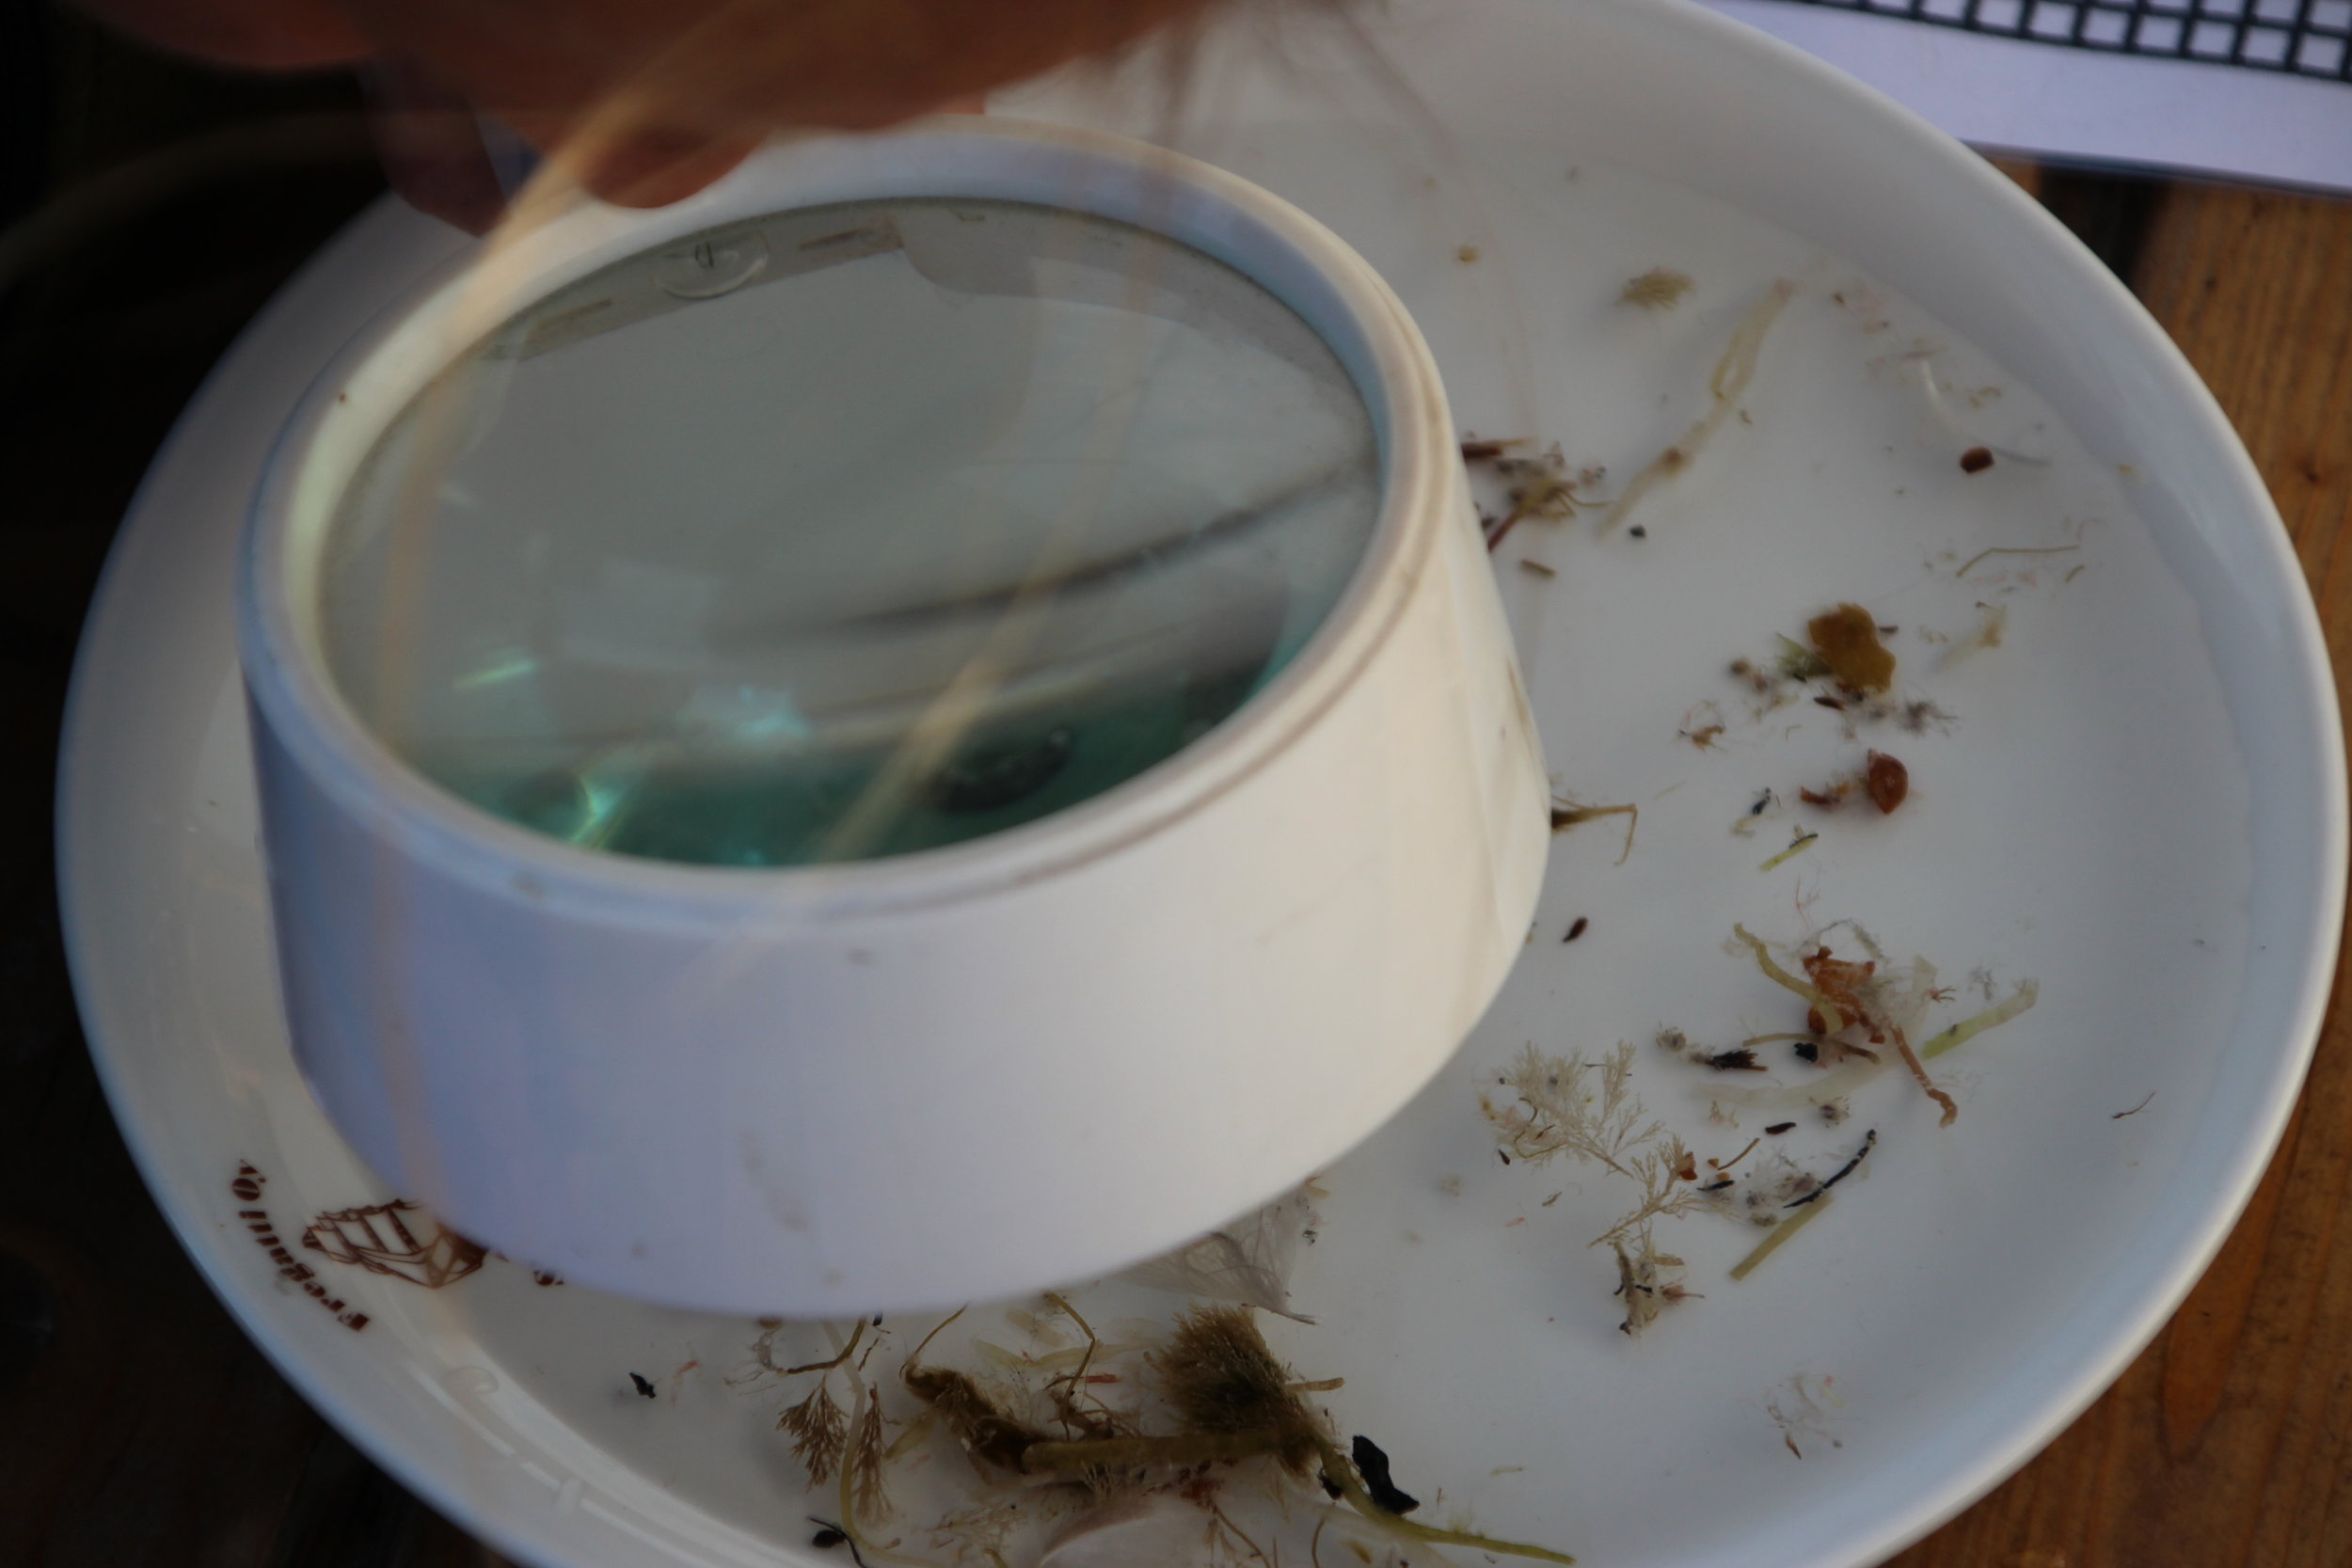
  2. Use the magnifying glass to look closely at the surface of the particles to make sure they are plastic. You may also use the tweezers to see if they are solid (plastic) or soft (usually not plastic).

  3. Lay all plastic pieces on graph paper (if possible, let it dry some place undisturbed). Using the ruler or lines on the graph paper, separate plastic pieces into size and type categories:

    a. Size categories-(particles>5mm),(particles<5mm)

    b. Type categories–(Fragment,Film,Foam,Pellet,Line)

  4. Count number of plastics for each category and record on data sheet.

  5. If available, prepare scale for weighing sample. Tare the scale with the

    container you are using. Take weight in grams. Record weight (next to the count) on the data sheet.

  6. Enter all data into Excel Sheet provided by 5Gryes

  7. Photograph the sample! Make sure to note the sample #in photograph. This is a very important step for later shape, size, color & type identification.

STORING AND SENDING DATA

10. Keep all samples separate, and number all samples and data sheets. Dry everything. Number everything.

11. For each sample, fold up graph paper around the plastic pieces and put everything in the envelope provided. However, it is very important to keep the samples separate if there are more than one sample. You will need one envelope and one piece of graph paper for each sample.

12. Email the following information to carolynn@5gyres.org

  1. Send photograph of plastic pieces on graph paper (foreach sample) with Sample # clearly stated

  2. Send photograph of each data sheet (for each sample)

  3. Send Excel Sheet (download from Trawl Share webpage) with your data filled in

  4. Send other interesting photographs of trawl deployment, boat, recovery, and anything else you’d like to share. Make sure to explain where the photograph was taken.

13.Mail data sheet and plastic pieces to 5 Gyres

  1. Data sheets should be filled out completely and accompany each piece of grid paper. Please make sure you include your contact information at the top of the data sheets.

  2. Send completed data sheets and plastic sample to: 5Gyres, c/o TrawlShare Program, 5792 West Jefferson Blvd, Los Angeles, CA 90016

Sk%C3%A6rmbillede+2019-07-24+kl.+12.04.03.jpg
Skærmbillede 2019-07-24 kl. 12.05.03.png

The Northern Fulmars

Plastic pollution is of worldwide concern. However, international commercial advances into the Arctic are occurring without knowledge of the existing threat posed to the local marine environment by plastic litter. The Arctic is currently an area of low human impact (Halpern et al. 2008), however, the global plastic industry is continuously expanding (Plastics Europe 2013), the use of disposable plastic products persists (WRAP 2014), and it is likely that the already significant amounts of plastic litter entering the marine environment will increase (Law and Thompson 2014). 

IMG_7870.JPG

A study by Alice M Trevail et al. at the Norwegian Polar Institute in 2014 quantify plastic ingestion by the Northern Fulmars (Fulmarus glacialis) from Svalbard. Theyfound that of 40 individuals, 87.5% had ingested plastic, averaging at 0.08g or 15.3 pieces per individual. Plastic ingestion levels in Svalbard thereby exceed the ecological quality objective defined by OSPAR for European seas (Heslenfeld et al. 2009).

Northern fulmars are entirely oceanic feeders, and omnivorous foraging behaviour renders them particularly vulnerable to plastic ingestion (Van Franeker et al. 2011). Fulmars tend not to regurgitate hard prey items, but they remain in the muscular stomach until they are broken down to a size that can pass through the gut. Therefore, stomach plastic contents represent a recent period prior to death, and thus plastic pollution in the local area (Van Franeker et al. 2011). Ingestion of plastic debris has direct negative effects on seabirds, such as internal wounds and blockage of the digestive tract (Gregory 2009), as well as causing secondary stress (Sievert and Sileo 1993; Auman et al. 1998) 

The high levels of ingested plastic observed in Svalbard not only highlight the risk to seabirds from plastic pollution, but may also be a considered as a general warning of effects of plastic litter in the Arctic. 

IMG_7869.JPG

Alice M Trevail et al. (2014) Plastic Ingestion by Northern Fulmars, Fulmarus glacialis, in Svalbard and Iceland, and Relationships between Plastic Ingestion and Contaminant Uptake. Kortrapportserie/Brief Report Series no. 029. Norwegian Polar Institute

Auman HJ, Ludwig JP, Giesy JP, Colborn T (1998) Plastic ingestion by Laysan Albatross chicks on Sand Island, Mid way Atoll, in 1994 and 1995, pp 239-244 IN: Albatross: biology and conservation / ed. Graham Robertson & Rosemary Gales. Chipping Norton: Surrey Beatty. 

Gregory MR (2009) Environmental implications of plastic debris in marine settings: entanglement, ingestion, smothering, hangers-on, hitch-hiking and alien invasions. Philosophical transactions of the Royal Society of London. B: biological sciences 364(1526): 2013–25. 

Halpern BS et al. (2008) A global map of human impact on marine ecosystems. Science 319(5865): 948–52. 

Heslenfeld P et al. (2009) EcoQO handbook: handbook for the application of ecological quality objectives in the North Sea. (OSPAR biodiversity series; 307). London. 

Law KL, Thompson RC (2014) Microplastics in the seas. Science 345(6193): 144–5. 

PlasticsEurope (2013) Plastics – the facts 2013: an analysis of European latest plastics production, demand and waste data. Brussels: PlasticsEurope 

Sievert PR, Sileo L (1993) The effects of ingested plastic on growth and survival of albatross chicks. pp 212-217 IN: The status, ecology and conservation of marine birds of the North Pacific: proceedings of a symposium [...] February 1990 / ed. Kees Vermeer et al. (Canadian Wildlife Service. Special publication). Ottawa. 

Van Franeker JA et al. (2011) Monitoring plastic ingestion by the northern fulmar Fulmarusglacialis in the North Sea. Environmental pollution 159(10): 2609–15. 

WRAP (2014) UK voluntary carrier bag monitoring: 2013 data. Banbury: WRAP.